Adding a search bar to the Bigfoot report titles and wiring it to the sightings map and plots.
Warning
I wrote this when Plotly Dash was brand new. Though the fundamental process and setup is the same, some of the details are quite a bit simpler now than they were when I wrote this.
In particular, the Dash Bootstrap Components library replaces the manually set CSS classes and works really well. Plotly Express makes generating the map easier too.
This is it, the final piece of the puzzle. The answer to questions no one thought to ask. The key to unlocking the sasquatch mystery.
Maybe.
This is part 3 of the details of my latest plan to make one million dollars by finding Bigfoot using Plotly’s Dash framework. I walked through the app structure and the interactive map in part 1. In part 2 I added a few more plots and made a more complicated layout. In this part I’ll add a search bar that filters the data in all of the plots using the text in the title and the real magic of the Dash framework: the callback decorator.
Input Bar
The first order of business is to add the input bar to the layout. I’ll also go ahead and add links to the data sources to the same row. The rest of the layout is unchanged at the moment.
app.layout = html.Div([
    # Row: Title
    html.Div([
        # Column: Title
        html.Div([
            html.H1("Bigfoot Sightings", className="text-center")
        ], className="col-md-12")
    ], className="row"),
    ############################################################################
    # NEW CODE
    ############################################################################
    # Row: Input Bar + References
    html.Div([
        # Column: Input Bar
        html.Div([
            html.P([
                html.B("Filter the titles:  "),
                dcc.Input(
                    placeholder="Try 'heard'",
                    id="bigfoot-text-filter",
                    value="")
            ]),
        ], className="col-md-6"),
        # Column: References.
        html.Div([
            html.P([
                "Data pulled from ",
                html.A("bfro.net", href="http://www.bfro.net/"),
                ". Grab it at ",
                html.A("data.world",
                       href="https://data.world/timothyrenner/bfro-sightings-data"),
                "."
            ], style={"text-align": "right"})
        ], className="col-md-6")
    ], className="row"),
    ############################################################################
    # Row: Map + DOW
    html.Div([
        # Column: Map
        html.Div([
            dcc.Graph(
                id="bigfoot-map",
                figure=bigfoot_map(BFRO_LOCATION_DATA))
        ], className="col-md-8"),
        # Column: Day of Week
        html.Div([
            dcc.Graph(
                id="bigfoot-dow",
                figure=bigfoot_dow(BFRO_LOCATION_DATA))
        ], className="col-md-4")
    ], className="row"),
    # Row: Year + Class
    html.Div([
        # Column: Year
        html.Div([
            dcc.Graph(
                id="bigfoot-by-year",
                figure=bigfoot_by_year(BFRO_LOCATION_DATA))
        ], className="col-md-8"),
        # Column: Class
        html.Div([
            dcc.Graph(
                id="bigfoot-class",
                figure=bigfoot_class(BFRO_LOCATION_DATA))
        ], className="col-md-4")
    ], className="row")
], className="container-fluid")
The search bar is a Dash Input component, but it isn’t wired to anything.
If I fired up the app right now it would show up, and that’s about it.
The server’s going to need a little work to make the magic happen.
Filter Function
The first thing the server’s going to need is a function that will filter the sightings data for us. Since the goal is to filter all of the data feeding the plots, it makes sense to write the function once and use it to filter the data before sending it to the individual plotting functions. This realization may or may not have come to me after I already wrote the same thing four times. Anyway, here’s what that function should look like:
# Compose list with filter using toolz.
listfilter = compose(list, filter)

def filter_sightings(filter_text):
    return listfilter(
            lambda x: filter_text.lower() in x['title'].lower(),
            BFRO_LOCATION_DATA
        )
This function takes some text and performs a substring search against the titles in BFRO_LOCATION_DATA, making sure everything’s in lower case so the search isn’t case sensitive.
A more sophisticated version might use some sort of index or fuzzy matching or even a little NLP, but a substring search is a good start.
One thing to notice is that the function closes around the BFRO_LOCATION_DATA variable, which is effectively in global scope for the application.
This isn’t a problem because I don’t ever ever ever ever modify it.
Once it’s initialized, it’s a constant.
Callbacks
It’s time to put the input bar and filter function to good use.
There’s one last modification I’ll need to make to the layout: remove the figure attribute from the dcc.Graph components.
app.layout = html.Div([
    # Row: Title
    html.Div([
        # Column: Title
        html.Div([
            html.H1("Bigfoot Sightings", className="text-center")
        ], className="col-md-12")
    ], className="row"),
    # Row: Input Bar + References
    html.Div([
        # Column: Input Bar
        html.Div([
            html.P([
                html.B("Filter the titles:  "),
                dcc.Input(
                    placeholder="Try 'heard'",
                    id="bigfoot-text-filter",
                    value="")
            ]),
        ], className="col-md-6"),
        # Column: References.
        html.Div([
            html.P([
                "Data pulled from ",
                html.A("bfro.net", href="http://www.bfro.net/"),
                ". Grab it at ",
                html.A("data.world",
                       href="https://data.world/timothyrenner/bfro-sightings-data"),
                "."
            ], style={"text-align": "right"})
        ], className="col-md-6")
    ], className="row"),
    # Row: Map + DOW
    html.Div([
        # Column: Map
        html.Div([
            dcc.Graph(
                id="bigfoot-map"
        ], className="col-md-8"),
        # Column: Day of Week
        html.Div([
            dcc.Graph(
                id="bigfoot-dow"
        ], className="col-md-4")
    ], className="row"),
    # Row: Year + Class
    html.Div([
        # Column: Year
        html.Div([
            dcc.Graph(
                id="bigfoot-by-year"
        ], className="col-md-8"),
        # Column: Class
        html.Div([
            dcc.Graph(
                id="bigfoot-class"
        ], className="col-md-4")
    ], className="row")
], className="container-fluid")
What I’m going to do next is wire the figure attribute of those components to the values returned by the callbacks, rather than having them statically built when the server starts.
Because the interaction is fairly straightforward - read the input and filter the data by title - the callbacks themselves aren’t complicated.
@app.callback(
    Output('bigfoot-map', 'figure'),
    [
        Input('bigfoot-text-filter', 'value')
    ]
)
def filter_bigfoot_map(filter_text):
    return bigfoot_map(filter_sightings(filter_text))

@app.callback(
    Output('bigfoot-by-year', 'figure'),
    [
        Input('bigfoot-text-filter', 'value')
    ]
)
def filter_bigfoot_by_year(filter_text):
    return bigfoot_by_year(filter_sightings(filter_text))

@app.callback(
    Output('bigfoot-dow', 'figure'),
    [
        Input('bigfoot-text-filter', 'value')
    ]
)
def filter_bigfoot_dow(filter_text):
    return bigfoot_dow(filter_sightings(filter_text))

@app.callback(
    Output('bigfoot-class', 'figure'),
    [
        Input('bigfoot-text-filter', 'value')
    ]
)
def filter_bigfoot_class(filter_text):
    return bigfoot_class(filter_sightings(filter_text))
Each of these functions works exactly the same way:
- Get the input from the text filter’s
valueproperty. - Filter the reports with the
filter_sightingsfunction based on the callback input. - Return the plot, sending the output to the
figureproperty of the corresponding graph in the layout.
Here’s what makes the Dash framework truly excellent in my opinion: effectively every thing I’ve written for this application down to the interaction callbacks is a testable, reusable piece of logic. The interactions aren’t done by binding specialized functions to fields in some data structure; they’re done by decorating a plain-ass Python function that, by itself, is useful code. In fact, the vast majority of the code in this app could easily have come from some module that was originally built for, say, an analysis notebook. It’s only the layout and callback decorators that are specific to Dash, not the entire app’s code base.
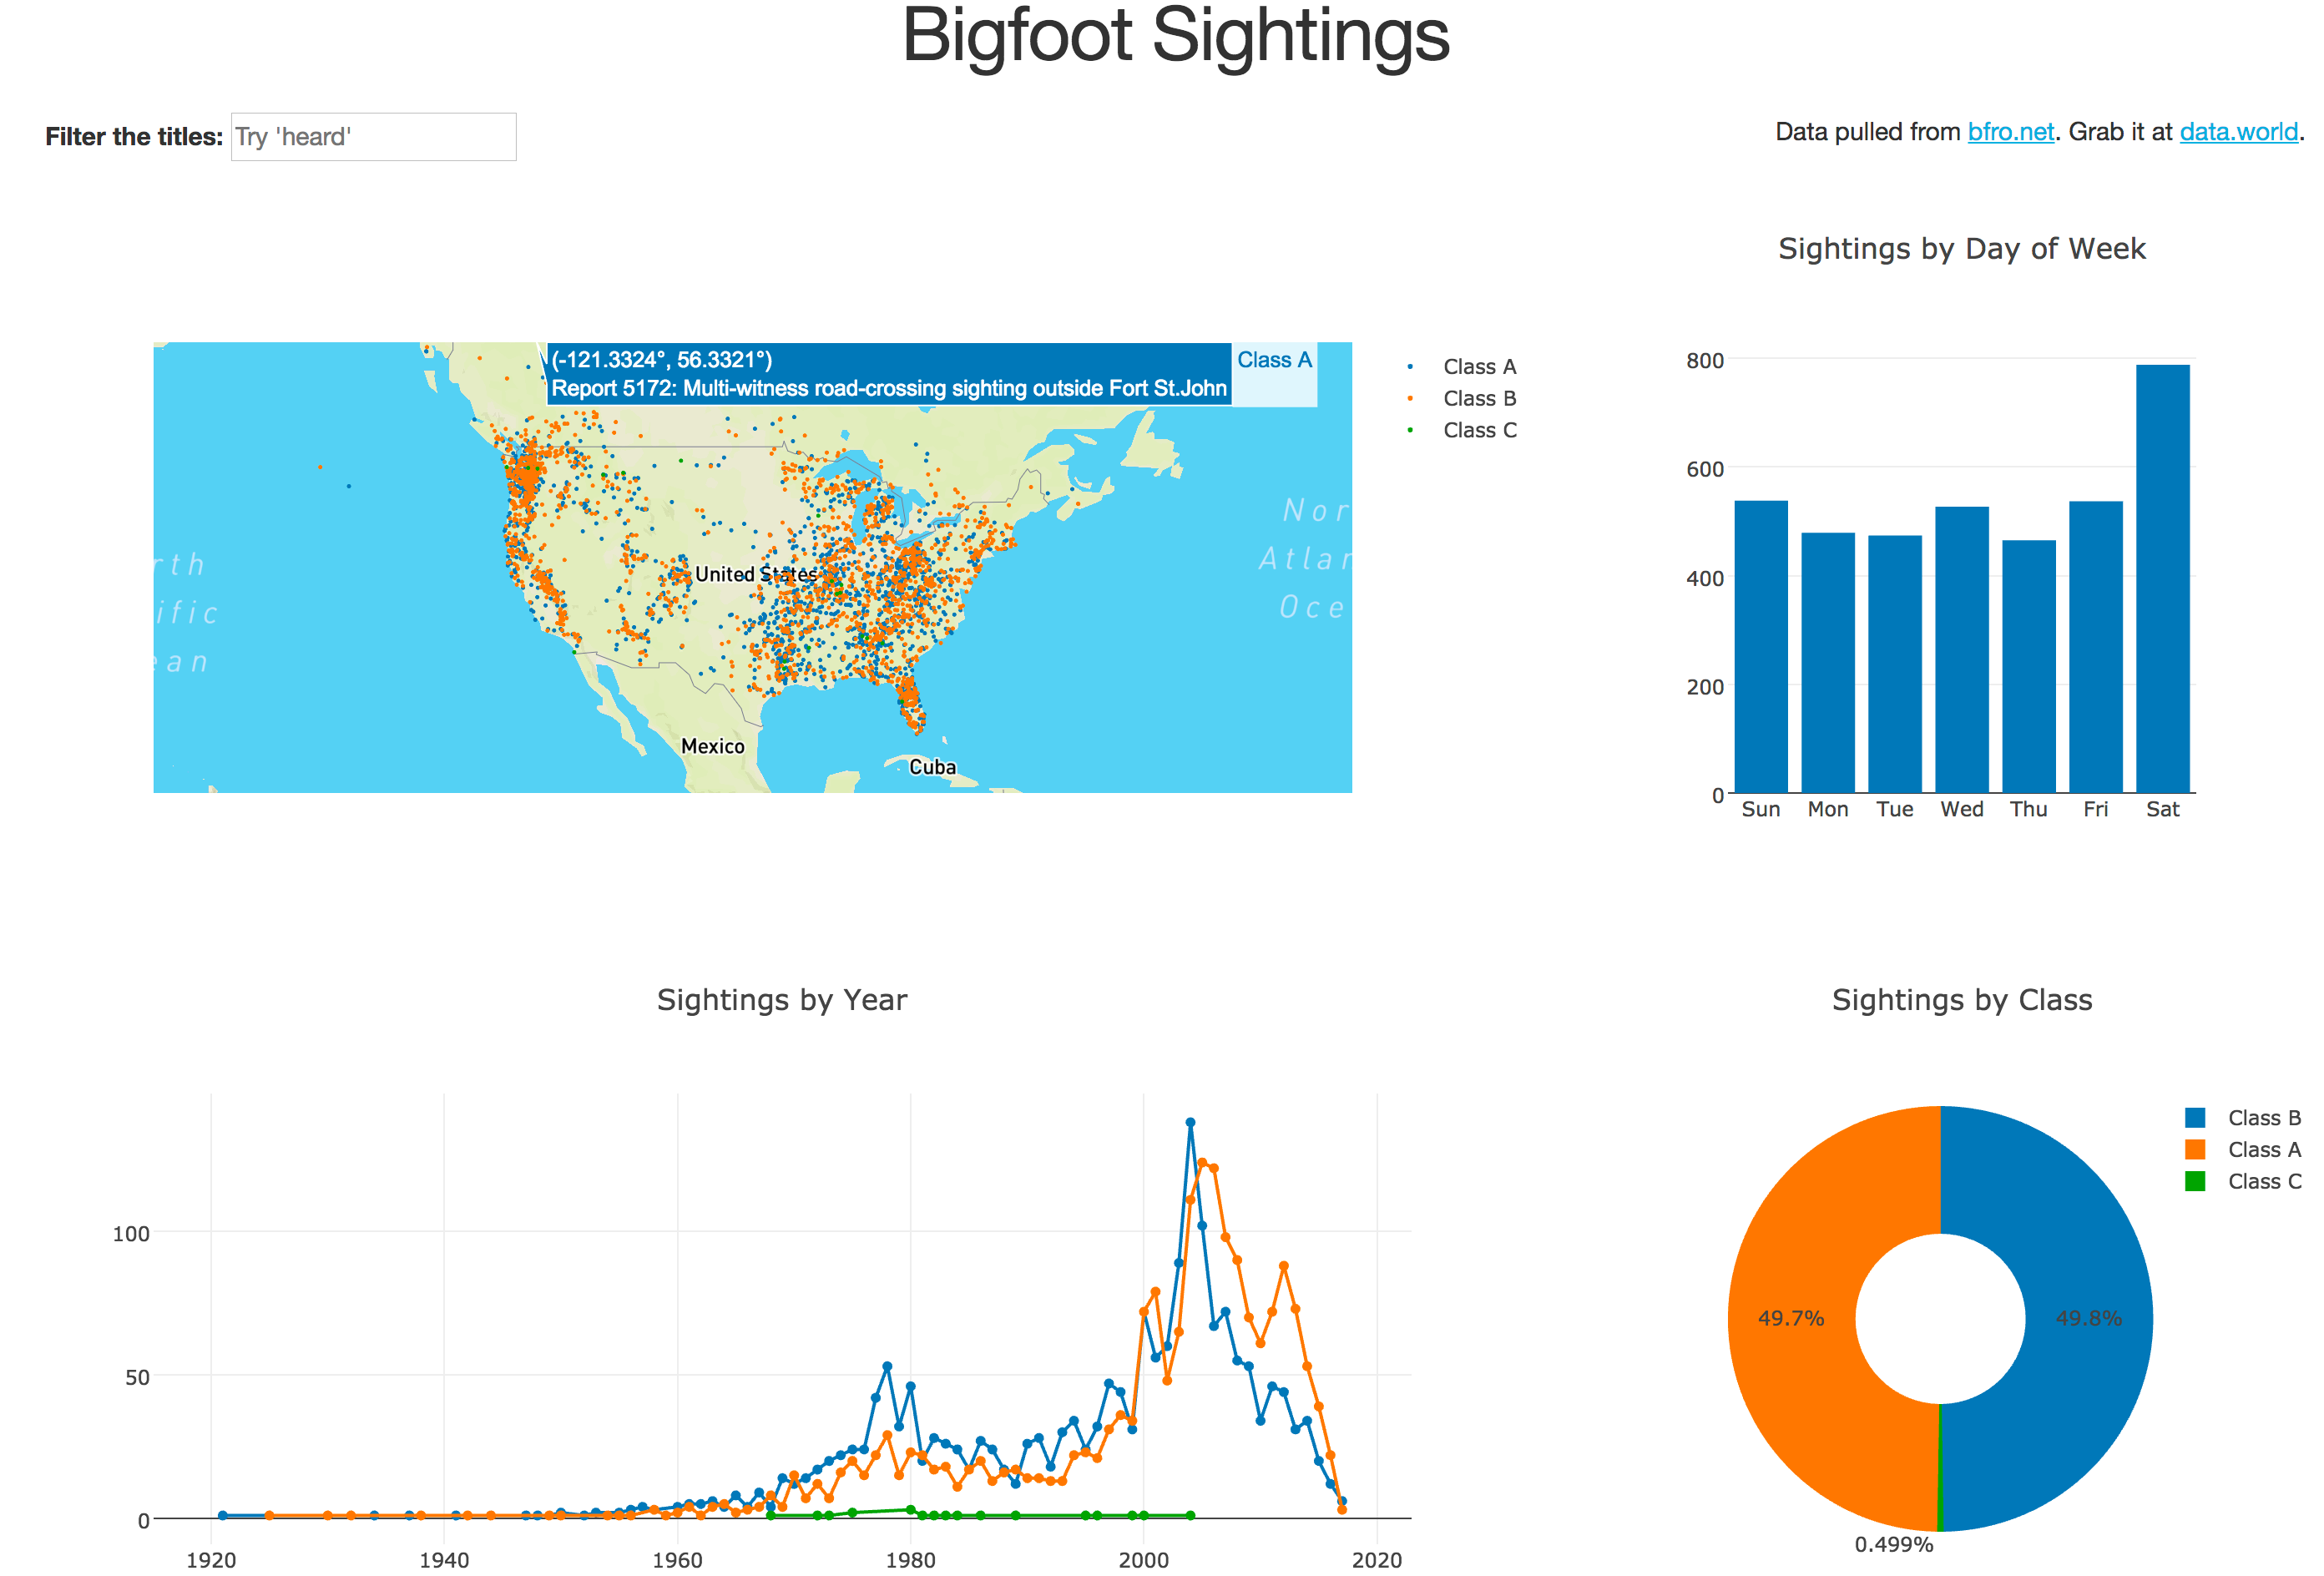
Anyway, enough gushing. If you fire up the app, it will work. It’s got all of the plots, all of the data, and all of the interactions. It looks like this:
There’s one more improvement to be made, however.
It’s probably pretty minor because there isn’t much data, but it was bugging me when I was putting this thing together.
You may have noticed that the filter_sightings function gets called four times with every callback.
The callbacks themselves are invoked every time the user types a character in the input bar.
If I can save the value of the filtered reports and send that to all of the plot function callbacks, then I only need to loop over that array once.
That’s what caching’s for.
Filter Function Again
The particular type of caching that works best here is called “memoization”, and the way it works is straightforward: when a memoized function is called, the inputs are mapped to the outputs and the map is stored in memory. If the function called again with that same input, it doesn’t need to be recomputed - the value can be returned outright because it’s stored. A function call turns into a lookup. Note that this only works for functions that are free of side effects and return the same output every time the function is called.
As I’ve already said, memoizing the filter_sightings function might get us a little more performance, or we might not notice.
Either way it can’t hurt.
Caching in Dash can be easily added with the flask-caching module because Dash is built on top of Flask.
This will require one additional installation:
pip install flask-caching
It’s also going to require initializing the cache and attaching it to the app server. Revisiting the original app initialization code:
import dash

#################################### NEW CODE ##################################
from flask_caching import Cache
################################################################################

app = dash.Dash()

# Title the app.
app.title = "Bigfoot Sightings"

#################################### NEW CODE ##################################
cache = Cache(app.server, config={"CACHE_TYPE": "simple"})
################################################################################
The Flask server lives inside the server attribute of the Dash object.
All I have to do is initialize the cache and pass it the underlying server and we’re ready to memoize our filter function.
# Compose list with filter using toolz.
listfilter = compose(list, filter)

#################################### NEW CODE ##################################
@cache.memoize(10) # Ten second timeout.
################################################################################
def filter_sightings(filter_text):
    return listfilter(
            lambda x: filter_text.lower() in x['title'].lower(),
            BFRO_LOCATION_DATA
        )
That’s it.
Decorate the function with @cache.memoize(10) and the cache will remember input->output mappings for 10 seconds before expiring them.
You can fire up the app again to make sure it works, but this time all of the changes were internal.
Odds are the caching didn’t make a huge difference but it did provide me the opportunity to learn how to use it.
Conclusion, Part 3
And that’s it! In this part I added the search bar to the map, bar chart, line/scatter plot, and donut chart with a pretty small code change. Overall this is what I like most about the framework: the ability to get an app ready to run and easily make incremental improvements, all while keeping the code factored into manageable and often reusable chunks.
Also I wrote zero Javascript.
If you want to see the whole thing together in one script, the full source code for everything is already on GitHub.
That’s it - we’re ready to rock. Happy hunting.